Growing our food consumes plenty of water – globally 70% of human uses of water. Choices in what food we eat have tremdous impact on our planet’s land and water resources, and on our human health. Growing one kg of rice takes 3 to 10 times the amount of water compared to 1 kg of millets.
In places like California, the demand for freshwater – for food, for the environment, industry and cities – outstrips availability. So how much water we use for growing food, matters. For water agencies who are tasked with designing sustainable water management and planning for the future, changing climate patterns can dramatically change water futures. So is changing cropping patterns. For example, in much of California’s Central Valley, annual row crops which could be fallowed have been converted to permanent orchards and vineyards, which require constant irrigation even in dry years.
Yet, we have incomplete, and dated, information on what crop is planted from season to season and year to year, how much irrigation water is supplied, and how much the crop is consuming.
Satellite-based intelligence
Taking a field that was planted with Rice in 2024 as an example, and choosing 5 years of data
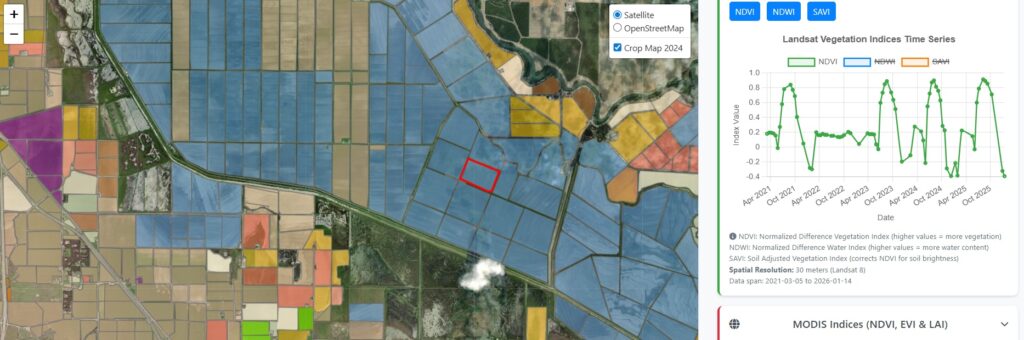
We see a cyclical pattern of the vegetation index (NDVI) peaking usually around August just before harvest in almost all years. Except in 2022 which was a year of deep drought- From the NDVI trace being flat in summer 2022, we can infer that this field was NOT planted with rice in 2022- it was fallowed.
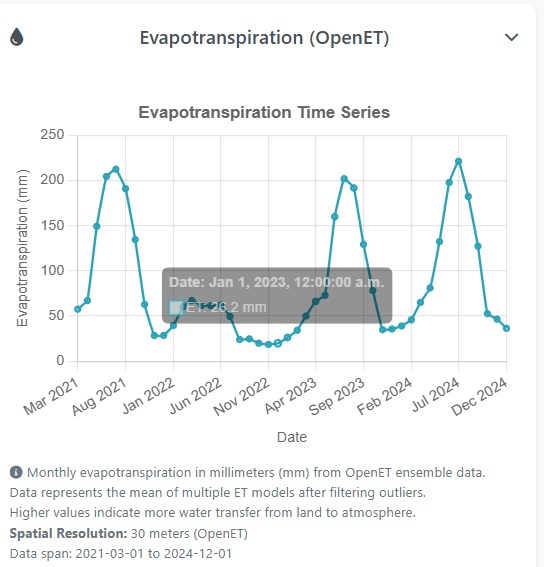
OpenET data extracted for the same field and data, corroborates this inference: Notice the similar cyclical pattern of rising ET through the summer of each year – except 2022, which has very low total ET, again indicating that no rice was grown in this field that year.
We cannot effectively manage what we don’t measure. Creative use of satellite data can be combined with local knowledge to fill in some of the critical knowledge gaps.